Memory Latency Hiding in CUDA using Streams (CUDA Adventures - 1)
- Cuda adventures
- April 4, 2022
Table of Contents
I’m starting a new CUDA project to deepen my understanding of GPU acceleration. I’ll begin with simple tasks like vector addition and move on to more involved projects, including image processing and language model optimizations. While this series won’t be a step-by-step tutorial, I’ll share the interesting parts of my implementations, highlighting the challenges I faced and the reasoning behind my decisions. For the complete code, feel free to check out the project repository.
In this first part, I’ll be focusing in the implementation of a simple vector addition kernel, with a focus on optimizing memory latency. All my experiments will be conducted on an RTX 2060 GPU.
Code Setup
Error Handling
In CUDA, most function calls return a status code of type cudaError_t to indicate success or failure. Checking the result of every single call can make your code unreadable. A common technique is to use a macro that wraps the function calls in error-checking logic. In my implementation, any error triggers a runtime exception, which can be caught and handled appropriately:
inline void checkCuda(cudaError_t result, const char* func, const char* file, int line) {
    if (result != cudaSuccess) {
        throw std::runtime_error(
            std::string("CUDA error at ") + file + ":" + std::to_string(line) +
            " (" + func + "): " + cudaGetErrorString(result)
        );
    }
}

#define CUDA_CALL(func) checkCuda((func), #func, __FILE__, __LINE__)
Memory Handling
If a runtime error occurs, the application might exit before you can manually free any allocated memory. To avoid leaks, I use a RAII (Resource Acquisition Is Initialization) wrapper for device memory. It automatically releases GPU memory when it goes out of scope or if the application terminates unexpectedly:
template <typename T>
class CudaMemory {
public:
    explicit CudaMemory(size_t size)
    {
        ptr = nullptr;
        CUDA_CALL(cudaMalloc((void**)&ptr, size));
    }

    // Prevent copying
    CudaMemory(const CudaMemory&) = delete;
    CudaMemory& operator=(const CudaMemory&) = delete;

    // Allow Moving
    CudaMemory(CudaMemory&& other) noexcept : ptr(other.ptr) { other.ptr = nullptr; }
    CudaMemory& operator=(CudaMemory&& other) noexcept {
        if (this != &other) {
            if (ptr) cudaFree(ptr);
            ptr = other.ptr;
            other.ptr = nullptr;
        }
        return *this;
    }

    ~CudaMemory() {  if (ptr) cudaFree(ptr); }

    T* get() const { return ptr; }

private:
    T* ptr;
};
Profiling CUDA Kernels
Nsight Compute
This tool focuses on kernel-level performance metrics—things like memory bandwidth, occupancy, and warp efficiency. You can analyze individual kernels in detail, identify bottlenecks (e.g., memory-bound vs. compute-bound). Nsight Compute replays kernel executions in multiple passes, collecting different sets of data each time. This approach aims to minimize performance overhead during any single run. It supports several profiling modes:
| Profiling Mode | How it works | When to use |
|---|---|---|
| Kernel Replay | Replays only the kernel execution. Saves GPU memory state before each kernel run and restores it before each subsequent replay pass. | Great for fast profiling when memory usage isn’t a concern. It can, however, double your memory usage. |
| Application Replay | Instead of saving and restoring memory states, relaunches the entire application for each pass | This approach requires that the application can produce consistent results across multiple runs and that relaunching the application is feasible in terms of time and resources. |
Nsight Systems
If you need a broader view that includes CPU-GPU concurrency, multi-threaded host code, and system-level timing, Nsight Systems is often more appropriate. It shows how different streams and tasks overlap, where synchronization points occur, and how host threads and device activity line up in a timeline. In other words, Nsight Systems is more about your application’s “big picture,” while Nsight Compute is a deep-dive into a specific kernel’s performance characteristics.
Profiling Mode - Always profile the kernels in Release mode if you are using Visual Studio instead of Debug mode for accurate performance.
Vector Addition Kernel
The actual vector addition kernel is straightforward. It reads from two input vectors and writes the sum into a third vector. The only extra detail is a boundary check. This is a compute light and memory bound task.
__global__ void addKernel(int* c, const int* a, const int* b, const unsigned long long length)
{
    unsigned long long idx = (blockIdx.x * blockDim.x) + threadIdx.x;
    if (idx < length)
    {
        c[idx] = a[idx] + b[idx];
    }
}
Single-Stream Processing
When your data fully fits in device memory (Memory for A + Memory for B + Memory for C), you can load it into the GPU, run one kernel, and then copy results back. By default, CUDA uses a single stream, so Host-to-Device (H2D) transfer → Kernel execution → Device-to-Host (D2H) transfer all happen sequentially.
However, if you have large data sets that don’t fit into device memory at once, you’ll need to split the data into smaller chunks. Each chunk is transferred, processed, and transferred back in a loop. The memory allocation for chunked vector addition is shown below.

By profiling the application through Nsight Compute, we can obtain the GPU utilization chart, which shows the speed of light (SOL) throughput for both memory and compute operations, as illustrated below. From the chart, we can infer that the vector addition kernel is memory bandwidth bound with high memory utilization (85%) compared to the compute utilization (20%).

Nsight Systems Trace of the application will reveal further insights. The kernel computation and memory transfer timeline can be viewed from the trace of the program execution as shown below, where multiple Load → Execute → Store operations are sequentially executed.

Because this approach runs each step in sequence, we can see that the GPU is sitting idle, waiting for memory transfers before executing kernel for each chunk of information. Thus, we need to “hide” these memory latencies by overlapping transfers with computation. Because each thread is doing just one or a few arithmetic operations per memory transaction, the key to improving performance is keeping the memory subsystem as busy as possible.
Memory Latency Hiding with Concurrent Streams
Memory Latency
Memory latency is the delay between the moment a processor (in this case, a GPU core or “thread”) requests data from memory and the moment that data actually arrives. Even though modern GPUs have incredibly high bandwidth—meaning they can move a lot of data per second—they still face latency because it takes time for each request to travel from the GPU’s on-chip cores out to the external memory chips (like GDDR6) and back. In our case, we need to transfer vector data from host memory (RAM/Disk File) to the device memory and then access it and transferring huge chunk of data per kernel executing is stalling the compute units.
Memory Latency: The number of cycles needed to perform memory loads/stores.
One effective way to hide memory latency is to use multiple streams. With concurrent streams, you can start transferring data for the next chunk while the current chunk is still being processed. This lets the GPU overlap Host-to-Device (H2D) transfers, kernel execution, and Device-to-Host (D2H) transfers.
Allocating Memory for Multiple Streams
First, we need to allocate separate device memory locations for each stream. This can be done by querying the total available free memory on the device and then splitting it across each stream as follows:
size_t free_mem;
CUDA_CALL(cudaMemGetInfo(&free_mem, nullptr)); // query free memory

// compute maximum vector length that can fit into device memory per chunk
size_t total_max_mem = free_mem * free_mem_threshold; // Limit memory usage in GPU
int num_vecs_in_device = 3 * num_streams; // A,B,C for each N Streams
size_t vec_max_mem = total_max_mem / num_vecs_in_device;
size_t vec_max_len = vec_max_mem / sizeof(int);

// compute chunk config
unsigned long long chunk_len = vec_max_len - (vec_max_len % MAX_BLOCK_DIM); // Making sure chunks can be divided into max block dim
size_t chunk_num = array_len / chunk_len; // Total number of chunks to be processed
int chunk_mem_size = chunk_len * sizeof(int);
For executing vector addition with 2 streams, the device memory is allocated as shown in the image below. It’s important to note that dividing the available device memory among streams means each stream processes less data at once compared to a single stream execution.

Processing Chunks in Parallel
Once you’ve set up the device allocations for each stream, you can distribute chunks to them in a nested loop. For every batch of chunks (limited by the number of streams), you transfer data to the device, run the kernel, and transfer the results back asynchronously:
// Process Vector in Stream Chunks
for (int chunk_index = 0; chunk_index < chunk_num; chunk_index = chunk_index + num_streams)
{
    for (int stream_index = 0; stream_index < num_streams; stream_index++)
    {
        int chunk_offset = (chunk_index+stream_index) * chunk_len;

        // Transfer Data to GPU Stream
        CUDA_CALL(cudaMemcpyAsync(dev_a[stream_index].get(), h_A + chunk_offset, chunk_mem_size, cudaMemcpyHostToDevice, streams[stream_index]));
        CUDA_CALL(cudaMemcpyAsync(dev_b[stream_index].get(), h_B + chunk_offset, chunk_mem_size, cudaMemcpyHostToDevice, streams[stream_index]));

        // Kernel
        addKernel<<<gridDim, blockDim, 0, streams[stream_index]>>>(dev_c[stream_index].get(), dev_a[stream_index].get(), dev_b[stream_index].get(), chunk_len);
        // Check for any errors launching the kernel
        CUDA_CALL(cudaGetLastError());

        // Transfer back to Host
        CUDA_CALL(cudaMemcpyAsync(h_C + chunk_offset, dev_c[stream_index].get(), chunk_mem_size, cudaMemcpyDeviceToHost, streams[stream_index]));
    }
}
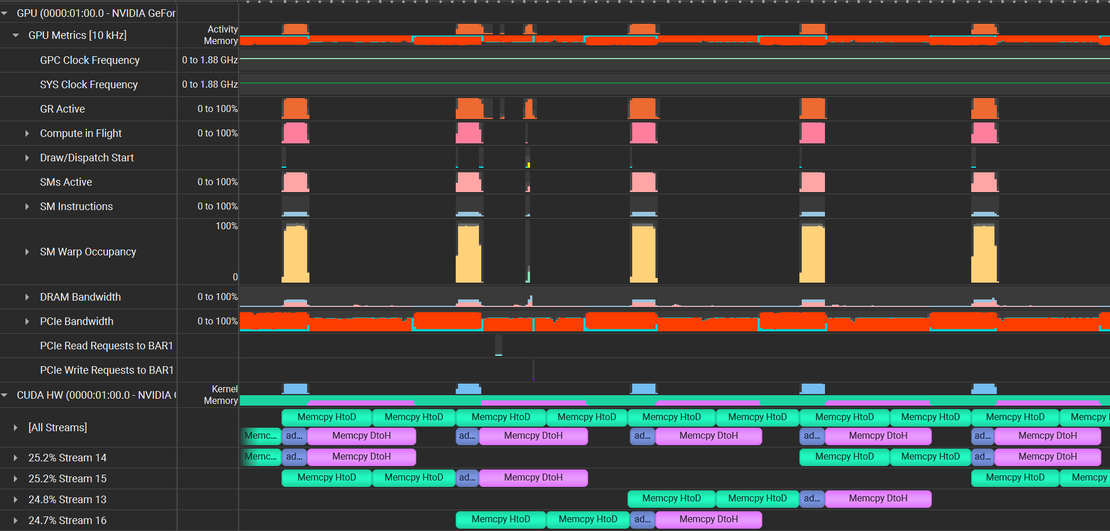
The following image shows Nsight system trace of multi stream execution, which shows that the second chunks H2D transfer starts even when the first chunk is still executing the kernel. Thus, while one stream is waiting on memory transfers, other streams can keep CUDA cores active.

Memory transfer overlapping - Modern NVIDIA GPUs have separate Direct Memory Access (DMA) engines for handling H2D and D2H transfers. Since these engines operate independently, H2D and D2H can run concurrently. But if you launch two H2D transfers or two D2H transfers, they must compete for the same DMA engine, causing serialization.
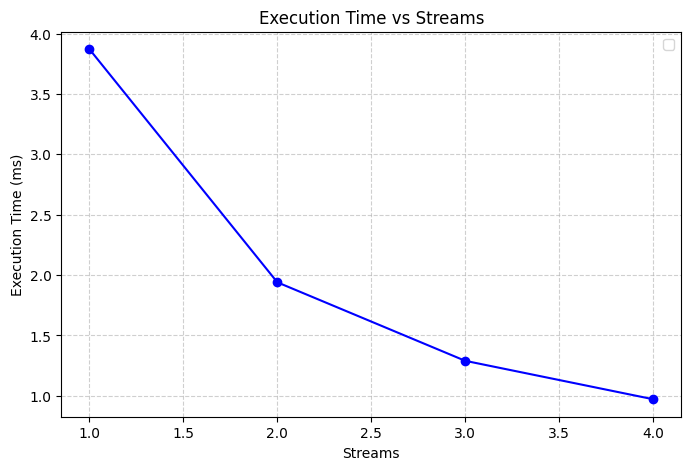
Below is a performance comparison chart for large vectors (536870912 integers, or 2GB of memory). Note how multiple streams significantly reduce total execution time:
| Host Memory | Streams | GPU Duration | Memory Throughput(Gbyte/s) | Mem Busy(%) |
|---|---|---|---|---|
| Pageable Memory | 1 | 3.86 ms | 277.19 | 39.66 |
| Pinned Memory | 1 | 3.87 ms | 278.40 | 39.76 |
| Pinned Memory | 2 | 1.94 ms | 277.04 | 39.29 |
| Pinned Memory | 3 | 1.29 ms | 277.87 | 39.58 |
| Pinned Memory | 4 | 972.19 µs | 275.42 | 39.50 |
By creating multiple streams, you effectively keep the GPU’s SMs (Streaming Multiprocessors) busier, reduce idle cycles, and boost overall efficiency. Increasing streams from 1 (3.87 ms) to 4 (0.972 µs) cuts the execution time dramatically—by about 75%.

Multiple Streams Overlap Transfers and Computations: When you add multiple streams (2, 3, or 4), you see a substantial drop in execution time (down to ~972 µs with four streams), but the throughput and Mem busy percentage remain in a similar range. The main gain here isn’t in speeding up the memory transfers themselves—it’s in hiding memory latency so that the GPU is doing useful work instead of waiting.
That wraps up the first part of this series. Stay tuned for more insights as I explore GPU acceleration and tackle increasingly complex tasks!